
True Deviation Impact: Measure What Matters
- May 28, 2021
- EIS Admin
- Blog Post
by Kevin White on 28th May 2021
There is no such thing as too much data, but, focusing on the “wrong” data means you will probably end up solving the wrong problem correctly.
Abstract:
Many in industry have real time data streams available. This information is often used mainly for performing post-mortem reviews of failures. What if the data could be used to show how much each problem was costing the process in dollars and cents? This is possible with the right information and tools. Instead of utilizing the historized data to analyze why a deviation cost $10K the previous week, that same data can show which problem will result in that anticipated amount by the end of the week.
By comparing real time data to a standard and valuing that deviation, True Deviation Impact (TDI) can be visualized in a format understandable by the whole organization. More often than not, this is accomplished with software and hardware already in place.
As a young naval nuclear trainee and then again as an instructor in the same pipeline, I was quickly introduced to the idea of the information “firehose” – as in, “Open up, and try to drink as much of this as possible.” Many operational scenarios require complex data analysis quickly. Those who most successfully drink from the hose efficiently engage with an overabundance of disparate data.
There is no such thing as too much data, but focusing on the “wrong” data means you will probably end up solving the wrong problem correctly. So, the challenge becomes how to prioritize the data; the aim being to take the firehose and reduce it to a manageable stream (no big deal, of course, in a world of ever-growing digitization and data availability).

Prioritizing Impactful Data
So, how do you actually prioritize effectively? Let’s examine a typical day for a supervisor at a manufacturing facility. When taking over the shift, they will immediately be confronted with problems that affect the operation - from a pump running in reduced capacity, to a crew missing an operator due to illness, to a break on a line for a high-end product. Each of these disruptions to the plan have different measurements; some of them may not even affect the overall plant schedule, unbeknownst to the supervisor. To be quantifiably successful, the supervisor needs to clearly understand the most impactful deviation to address. This requires the different variables to be contextualized, or indexed, to a common metric. But what is that metric?
Everything that costs something is accounted for in manufacturing. From labor hours to replacing equipment to raw materials to leasing buildings, there are both expected and unexpected costs that are included in the plant’s operating budget. Improving profitability in manufacturing requires reducing these costs; therefore, all metrics should be indexed to the plant’s Profits and Loss (P&L) sheet (a true “gradecard” for the operations of the plant, usually standardized throughout an organization). Although the “planned vs actual” approach seems overly simple, it quickly allows everyone to see a deviation from the “plan”, and whether that “delta” is in a positive or negative direction. The “plan” could be standard material usage, average run time, required time for response, or OEM performance requirements, all decided by the plant locally. So, how is that “impact” understood by those using this information, especially if each factor is measured in different units? How can they utilize it to successfully prioritize resource allocation?

What if we transform that more manageable data stream into a financially impactful key performance indicator (KPI)? The final evaluation for measurement necessity is:
- How much is that deviation worth to my operation?
or
- Can a value be applied to the variable not going to “plan”?
These valuation questions quickly eliminate the variables which seem critical, focusing only on those the organization is truly using to measure success. If financial success is based on meeting or exceeding the annual operating budget, then all deviations which affect those financial variables should be included.
Let’s revisit our supervisor who is trying to align real time operations with an expected plan and associated budget. Without the visualization and clarity of the cost impact of each discrepancy, the supervisor will rely on personal experience, thumb rules, and “gut feel” to determine which problem to attack first. However, if each fault were shown indexed to a cost metric, then the corrective action prioritization will be much more financially impactful.
Deviation Drives Cost
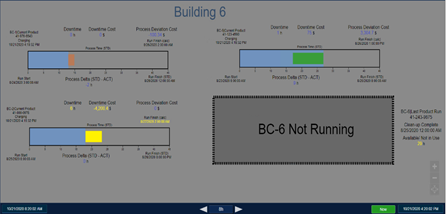
Assuming the only issues facing the supervisor are those mentioned above (pump in reduced status, missing operator, and line break), then each can provide a real time measurement of their deviation from the “plan” (8 gpm low, 7 of 8 crew, and 5 hours downtime).
Understanding the deviations’ impact and converting it to a financial metric is critical. For example, the pump running at reduced output slows the process down a proportionate amount, extending the product cycle time. This increased cycle time would “cost” the operations due to the product exceeding an expected duration. This time has associated costs, including increased machine time, increased raw material usage, and increased labor time. Every impact should be contextualized to understand its effect on the deviation from plan. In this manner, every deviation with an associated cost can be ranked for the supervisor’s use.

The supervisor now has data supplied by real time variables indexed to a common set of metrics – cost. Arriving at the beginning of the shift, the most financially impactful deviations will be visible, allowing the supervisor to direct resources efficiently and effectively. Not only will the system allow visibility of ongoing issues, it will also show when addressed problems have been resolved (returned to the plan), since the deviation (and associated impact) would then return to 0. As new deviations arise during the shift, they will be automatically stacked in order of financial impact. This will not only allow flexible resource allocation, but it will ensure that “new” problems which seem to be critical do not overcome those which are truly larger deviations by cost.
True Deviation Impact
Sounds great, right?
All your problems listed in descending order with the highest impacts (cost in dollars) at the top, updating in real time using system process variables.
I love acronyms (the Navy instilled this love), so I call this TDI, True Deviation Impact.
- True because the data can be directly mapped to a real time variable,
- Deviation because the cost above or below plan is based on a deviation from that plan,
- Impact because the deviations are indexed to financial impact in dollars.
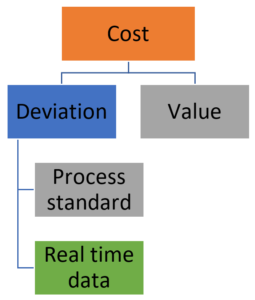
Although it may seem this calculation has many moving parts, it in fact only has 3 parts (and only one of those is dynamic): the real time variable you are measuring (dynamic), the standard for that variable (to compare against - static), and a cost rate (how much does that measurement cost you - static). The two static portions are usually found in tables or forms and do not change frequently. Once static information for standard and cost rate have been entered, the future state of the TDI calculation could incorporate live, digital standards and rates to remove even more manual intervention. Depending on the definition of success (running to projected schedule, running to best ever schedule, running to idealized schedule, running to industry average schedule), TDI can be used to calculate savings of improvements; it can also show opportunity costs for calculating future continuous improvement project impacts.
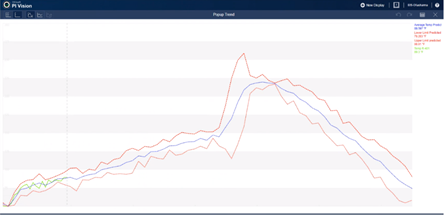
Although this may seem like a heavy investment in resources, many companies already have the required hardware, software, and/or digital architecture required to take advantage of TDI. At a basic level, there are 4 major components required to fully leverage real time digital data to drive financially impactful actions: a data historian, an integrator, a visualizer, and a workflow engine (ex. PI Data Historian, PI Asset Framework, PI Vision, and OpsTrakker). These tools allow real time data to be contextualized and then visualized in a clear manner, driving user actions to return the measurement to the “plan”.
Standardize, Then Optimize
To close this discussion on True Deviation Impact, its evolution, its simplicity, and its attainability, note the absence of the word optimization in this document to this point; this was both purposeful and intended. True Deviation Impact does not optimize systems; it enables standardization. When there are no deviations from the plan and it is financially reflected as $0, then, and only then, can true optimization occur by improving the standard. Without a system “in-control” in relation to its standard, optimizations will not survive, as deviations may potentially erase any standardization gains.
A quick case study to illustrate this concept: A manufacturing company had various assets producing materials. The processes were largely manual and required trained operators to interact with the production vessels. There was an average time to produce these materials, and it was used for planning. Upon further review of individual runs, there were large variations (both faster and slower) in batch times. In the data analysis, it was determined that focus on deviations from standard (a standardization approach) would have a greater effect on overall savings than attempts to improve the average run time (an optimization approach). Manufacturing consistently, not just faster, impacts raw material ordering, labor loading leveling, improved maintenance planning, decreased on hand inventory requirements, and integrations with upstream and downstream value stream partners and clients. True Deviation Impact quickly informs the digital value stream ecosystem about where any deviations are occurring and how impactful they are to the system, driving visibility, standardization, and consistency.
If you have questions regarding this topic or would like to learn how the EIS Operational Intelligence (OI) team can help operationalize this,
Click Here.